
Yield Ratio Of Potato To Frozen French Fries: EPC Capacity Planning Guide
The typical yield ratio from raw potato to frozen french fries ranges from 35% to 45% depending on raw material quality, processing technology, and product specifications. For industrial production line design, this ratio determines every major system component from storage capacity to packaging throughput.
- Key Signal 1: 1 ton potatoes → 350-450 kg frozen fries
- Key Signal 2: 15-25% raw material cost variance impact
- Key Signal 3: 8-12% efficiency gain with premium equipment
- Key Signal 4: 3-5 year ROI on yield optimization systems
- Key Signal 5: 30-50 tph line capacity scaling factor
Global frozen french fries production facilities require precise yield calculations to optimize capital investment and operational efficiency across 50+ countries with varying potato supply chains.
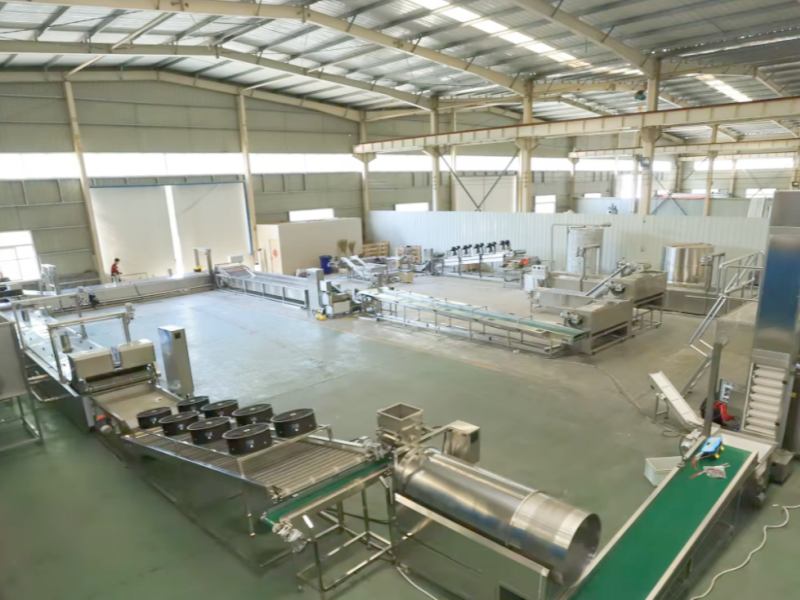
Yield Ratio Fundamentals for Production Line Design
Yield ratio serves as the foundational parameter for entire factory engineering. Every mass flow calculation begins with this conversion factor. EPC engineers use yield data to determine raw material intake capacity, intermediate storage volumes, and final product handling systems. A miscalculation of just 2% yield can result in 15-20% capacity shortfall or overinvestment in storage infrastructure.
Raw Material Impact on System Sizing
Potato variety, solids content, and size distribution directly affect yield. High-solids processing potatoes deliver 42-45% yields versus table potatoes at 35-38%. This 7-10% difference translates to 70-100 tons additional annual output on a 30 tph line running 300 days. EPC engineers must specify raw material procurement standards before finalizing equipment capacities.
Process Stage Losses and Equipment Selection
Each processing stage contributes to yield reduction. Peeling removes 15-20% of raw weight. Trimming and sorting eliminate another 8-12%. Blanching and frying cause 12-15% moisture loss. Freezing and packaging account for 2-3% final product loss. Understanding these cascading losses enables precise equipment sizing and buffer storage design.
Calculating Net Throughput for Capacity Planning
Target annual production divided by yield ratio equals raw potato requirement. A 50,000 ton frozen fries target at 40% yield requires 125,000 tons potato intake capacity. This determines receiving dock design, storage silo volume, and pre-processing handling systems. EPC proposals must include detailed mass balance calculations showing each conversion stage.
Engineering Parameters Affecting Conversion Efficiency
Equipment design and process parameters directly influence yield outcomes. EPC specifications must balance capital cost against yield optimization potential. Modern processing lines incorporate multiple control points to minimize losses at each stage. Engineering decisions made during design phase lock in yield performance for the facility operational lifetime.
Peeling and Trimming Losses
Steam peeling systems achieve 15-18% loss versus abrasive peelers at 18-22%. The 3-4% difference on a 40 tph line equals 1.2-1.6 tons hourly product value. Modern steam-peeling with precision pressure control reduces losses while maintaining surface quality. Equipment selection directly impacts yield and must align with raw material characteristics.
Cutting Precision and Sizing Accuracy
Water knife cutting systems produce 2-3% higher yields than mechanical blades by reducing slivers and breakage. Strip width accuracy affects downstream sorting losses. Oversized pieces require re-cutting, generating 5-8% additional waste. Engineering specifications must include cutting tolerance parameters and blade maintenance schedules to maintain yield targets.
Moisture Control and Weight Management
Final moisture content after frying typically reaches 60-65% of raw potato weight. Advanced moisture removal systems in the freezer and packaging area can recover 0.5-1% additional yield through reduced ice crystal formation and product clumping. This micro-optimization accumulates significant value over production cycles.

EPC Implementation: From Yield Data to Factory Layout
Yield ratio transforms from theoretical calculation to physical infrastructure through EPC engineering. Every building dimension, equipment footprint, and utility connection scales from yield-based mass flow. Shandong-based EPC contractors with 200+ global projects apply yield data to create optimized factory layouts that minimize material handling and maximize process efficiency.
Storage and Handling Infrastructure
Raw potato storage must accommodate 3-5 day buffer based on yield calculations. At 40% yield, a 30 tph line requires 2,250 tons daily potato intake. Storage design includes ventilation, humidity control, and handling equipment to minimize pre-processing losses. EPC scope includes complete material flow from truck unloading to processing line infeed.
Parallel Processing Units Configuration
Yield variations require modular equipment design. Two 20 tph lines provide better yield management flexibility than one 40 tph line when processing mixed potato grades. Parallel systems allow grade-specific parameter optimization. EPC design must balance capital cost against operational flexibility for yield optimization.
Utility Systems Scaling Based on Yield Factors
Yield ratio determines water, steam, and energy requirements. Each ton of processed potato consumes 1.2-1.5 m³ water, 0.8-1.1 GJ energy. At 40% yield, utility systems must support 2.5x raw material throughput versus finished product. EPC engineering includes complete utility balance calculations and infrastructure sizing.
Real-World Capacity Planning Scenarios
Industrial projects demonstrate how yield ratio variations impact facility design and economics. EPC contractors must model multiple scenarios to ensure robust design against raw material variability. The following table illustrates yield differences across potato grades and product specifications commonly encountered in international projects.
| Potato Grade | Target Product | Yield Range | Annual Output Impact (30 tph line) |
|---|---|---|---|
| Processing Grade A | 8-10mm premium strips | 43-45% | +2,700 tons vs baseline |
| Processing Grade B | 6-8mm standard strips | 38-42% | Baseline performance |
| Table Grade | Variable sizing | 35-38% | -2,400 tons vs baseline |
| Organic/Specialty | Strict defect criteria | 33-36% | -3,600 tons vs baseline |
A European 35 tph facility processing mixed grades achieved 39% average yield by implementing grade-segregated processing lines. Initial single-line design projected 36% yield. The 3% improvement increased annual revenue by €2.1 million. EPC design included optical sorting pre-peeling and variable cutting configurations. This case demonstrates why yield ratio analysis must drive line architecture decisions rather than treating it as static assumption.
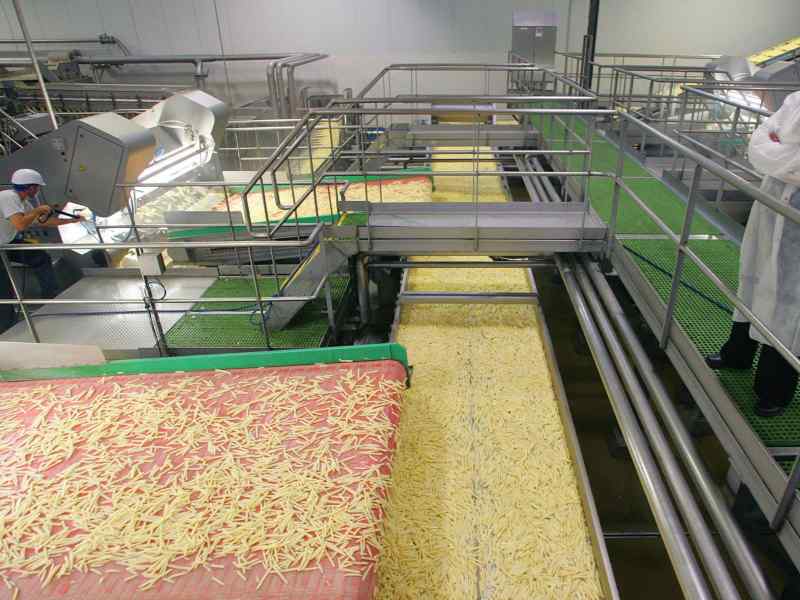
Investment Implications of Yield Variations
Yield ratio directly determines project economics and return on investment timelines. EPC proposals must quantify financial impact of yield assumptions to support investment decisions. Industrial clients require detailed cost-benefit analysis showing how equipment selection and process design affect long-term profitability.
Raw Material Procurement Strategy
Yield ratio dictates procurement contracts. Long-term agreements with processing potato growers ensure consistent 42-45% yields. Price premiums of 8-12% for high-solids varieties are offset by 10-15% throughput gains. EPC projects include raw material sourcing consultation as part of feasibility studies to secure optimal potato supply.
Equipment ROI Calculations
Premium peeling and cutting equipment costing 15-20% more delivers 3-5% yield improvements. On a 30 tph line, this generates €1.8-3.0 million additional annual revenue. Payback period ranges from 18-24 months. EPC proposals quantify ROI impact of equipment selection decisions to support capital approval processes.
Long-Term Operational Cost Planning
Yield variance affects labor, energy, and waste management costs. Lower yields increase waste disposal volumes and water treatment requirements. EPC design includes waste recovery systems that convert peels and trimmings to animal feed, offsetting 2-3% of operational costs. Comprehensive lifecycle cost analysis shows yield optimization equipment pays for itself within 3 years.
Yield Ratio Planning FAQs for Industrial Projects
How does yield ratio affect cold storage design?
Cold storage capacity must handle finished product volume, but pre-cooling and buffer zones scale with raw material intake. At 40% yield, pre-cooling systems handle 2.5x the finished product weight. EPC design integrates buffer storage between frying and freezing to manage yield-based flow variations and prevent bottlenecks.
What yield ratio should be used for preliminary investment calculations?
Use conservative 38% yield for initial capex estimates. This accounts for raw material variability and start-up inefficiencies. Final EPC design refines to 40-42% based on specified potato grades and equipment selection. Financial models should include sensitivity analysis across 35-45% yield range to assess project risk.
Can yield ratio be improved after line commissioning?
Yes, through process optimization and operator training. Typical 2-3% improvement achievable in first 12 months. EPC contracts include performance guarantee clauses and optimization support. Equipment upgrades like advanced sorting systems can add another 1-2% yield in years 3-5, extending line profitability.